
What Is an Overlay Bet? Fair Odds, Worked Maths and Uncertainty
12 Aug 2026 · 6 min read · True Overlay teamUpdated
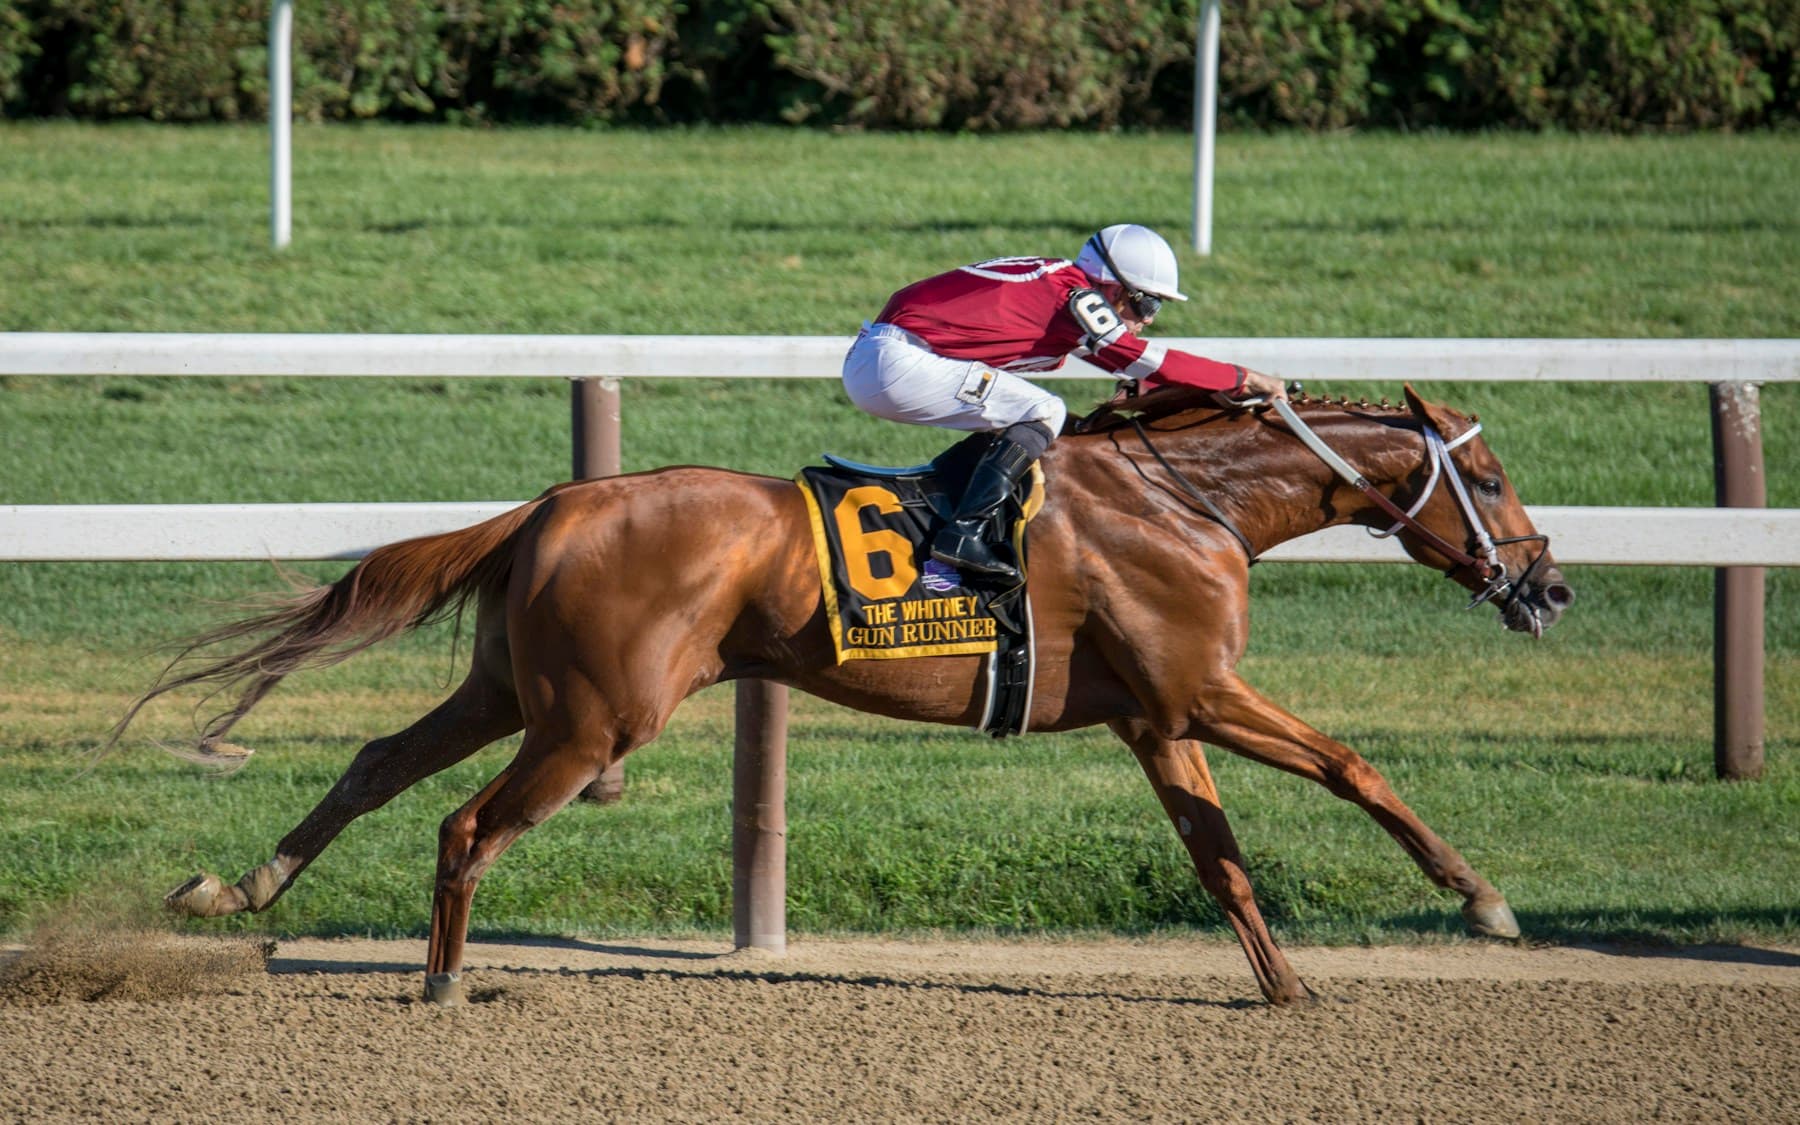
In horse racing, an overlay means the available odds are longer than the fair odds implied by your estimated winning probability. Equivalently, your estimated probability exceeds the price's break-even probability before costs. It is a comparison of estimates and prices, not proof that a horse will win or that a model has found a real advantage.
Keep three things separate: the quoted price, the model's estimated chance, and the horse's unknown actual chance. You can observe the first and calculate with the second. You cannot establish the third simply by asking an AI to explain its selection. Every number below is hypothetical, not a real race, tip, or True Overlay result.
Convert the odds before comparing them
Decimal odds include the returned stake: fractional odds of 9/2 become 1 + 9 ÷ 2 = 5.50. The raw implied probability is 1 ÷ decimal odds, so 5.50 implies approximately 18.18%. Smarkets' educational conversion guide, linked below, documents these odds-conversion formulas; the calculations here use our own fictional example.
For an estimated winning probability p expressed as a decimal, fair decimal odds are 1 ÷ p. At p = 0.25, that is 4.00, or fractional 3/1. A quote of 5.50 is therefore an overlay relative to that 25% estimate. A quote of 3.00 is an underlay relative to the same estimate. Neither label establishes that the estimate is accurate.
Worked example: expected value is not money earned
For a simple win-only wager with no deductions, fees or dead heat, expected net value per unit is p × D − 1, where D is decimal odds. This comes from weighting the winning net return D − 1 by p and the losing return −1 by 1 − p. It is conditional on p being a sound estimate.
At an assumed 25% chance and 5.50 odds, 0.25 × 5.50 − 1 = +0.375 units per unit, or +37.5%. A fictional one-unit wager would actually return either +4.50 units net if it wins or −1 unit if it loses; it does not pay +0.375 units. At 3.00 odds, the same assumption gives −0.25 units, or −25%.
Change the assumption to an 18% chance while keeping 5.50 odds: 0.18 × 5.50 − 1 = −0.01 units, or −1%. The attractive-looking overlay has disappeared. This is a sensitivity check, not a statistical confidence interval or a measured uncertainty range for our model.
Keep the market baseline separate from the offered price
A field's raw implied probabilities need not sum to 100%. For a fictional three-runner win market priced at 2.00, 3.00 and 4.00, their sum is 50% + 33.33% + 25% = approximately 108.33%. Dividing each raw probability by the total produces a proportional baseline of approximately 46.15%, 30.77% and 23.08%.
That normalization is a modelling convention, not discovery of the runners' true chances. Do not substitute its fair odds for the price actually available when calculating a possible payout. Record the same market, runner set and quote time; a withdrawn runner, changed conditions, stale quote or different settlement rule can invalidate the comparison. Fees and deductions also change net returns.
What evidence should support the probability?
Ask where the inputs came from, when they were observed, what is missing, and whether the forecast was saved before the outcome. An explanation can be fluent without being well supported. Do not infer that an analyst or AI has found systematic market errors merely because it produces a different price.
Calibration checks whether predicted probabilities match outcome frequencies across a sample. For example, among many predictions near 25%, an observed win rate near 25% would support calibration in that range, subject to sample uncertainty. The scikit-learn calibration guide explains this distinction. Calibration alone does not establish a profitable strategy; our separate validation article covers how to test forecasts against a market baseline without hindsight.
Use the example before evaluating a subscription
Start with True Overlay's no-account worked example, then inspect coverage, methodology and the public results ledger. As checked on 12 September 2026, the live pipeline is not configured, the health endpoint reports zero stored races and predictions, and paid access is not open. Implemented analysis features are not evidence of live delivery or validated accuracy.
The pricing page describes planned research access; it should be evaluated alongside current availability, not treated as proof that a subscription can be purchased today. The links below let you inspect those boundaries without entering checkout. This educational article contains no affiliate offers or operator recommendation.
For legal-age adults only. An apparent overlay can lose, and repeated wagers can compound an incorrectly estimated edge. There is no requirement to bet to learn from the arithmetic. Never chase losses or treat gambling as dependable income; see our responsible-use guidance for support resources.
Sources and further reading
See the idea in a worked example
Compare an estimated chance with a market price, understand the uncertainty, and see what the product is designed to show. No account required.
Explore the example